Expert Tips
Considerations for Setting Building-Level Benchmarks for Life Cycle Assessment
Highlights the complexities of building design and life cycle assessment (LCA) methodologies and considerations for setting accurate benchmarks to compare carbon performance
This article builds on WoodWorks’ body of knowledge about the life cycle assessment of buildings. See the full list of sustainability-related resources for introductory content and detailed LCA studies.
Life cycle assessment (LCA) is increasingly used by project teams both to evaluate the environmental impact of their designs and compare them with past projects or hypothetical, alternative designs. WoodWorks has published numerous comparative LCA studies in which a given building is designed in wood and then redesigned using alternative materials (e.g., steel and/or concrete). While this approach of developing project-specific alternatives is the most robust way to make building-level LCA comparisons, it creates a significant burden for design teams. Thus, there is growing interest in creating benchmarks that represent average building performance and serve as measuring sticks to evaluate new designs.
Benchmarking efforts attempt to answer the question, “What is the impact of a typical building?” and rely on LCA data from a representative set of prototypical buildings, statistical analysis of a compiled set of actual buildings, or a combination of the two. Regardless of the data used to develop a benchmark, it is important to understand the major sources of variability of LCA results between studies. The two most significant sources of variation are 1) inherent differences between building designs, and 2) underlying differences in the LCA scope and methodology. Differences between building designs make it challenging to define a “typical” building—and the purpose and intended use of a benchmark will influence how such differences are addressed in its development. Differences in scope and methodology between LCAs are more subtle, but have a large impact on the assessment results.
Using examples from two comparative LCA studies published by WoodWorks in conjunction with KPFF Consulting Engineers, Life Cycle Assessment of Prototypical Office Buildings in a High-Seismic Location and Life Cycle Assessment of Prototypical Office Buildings in a Moderate-Seismic Location, this article explores these sources of variability along with potential paths to address them when developing benchmarks. Both studies compare mass timber, structural steel, and reinforced concrete gravity force-resisting systems with five lateral force-resisting system combinations (three mass timber, one steel, and one reinforced concrete). The results are primarily based on structural material quantities (excluding most architectural components) and focus on global warming potential (GWP) as a measure of embodied carbon impacts.
Differences in Building Designs
Building Occupancy and Use
Many aspects of a building’s design are dictated by its intended use. The occupancy group plays a role in defining overall size and layout, fire protection requirements, structural loading requirements, aesthetic choices, and other material decisions. It follows that buildings designed for different uses could have drastically different LCA results, which must be considered when developing benchmarks.
The LCA studies referenced above were developed for office building typologies using prototypes defined by the U.S. Department of Energy (DOE). The DOE provides 16 different prototypical commercial buildings such as hotels, schools, hospitals, and restaurants. Because of the inherent design differences between these building types, they don’t lend themselves to comparison. For example, it would not be reasonable to assess the GWP of a school based on a benchmark developed primarily from data collected on apartment buildings. Therefore, benchmarks should be developed for different buildings based on their use and function.
Building Size
The total GWP of a building is correlated with its size; a larger building has more materials, takes more effort to build, and therefore has a larger impact. To help understand relative impacts, GWP is typically reported as a normalized value in terms of kilograms of carbon dioxide equivalent per square meter of building area (kg CO2e/m2).
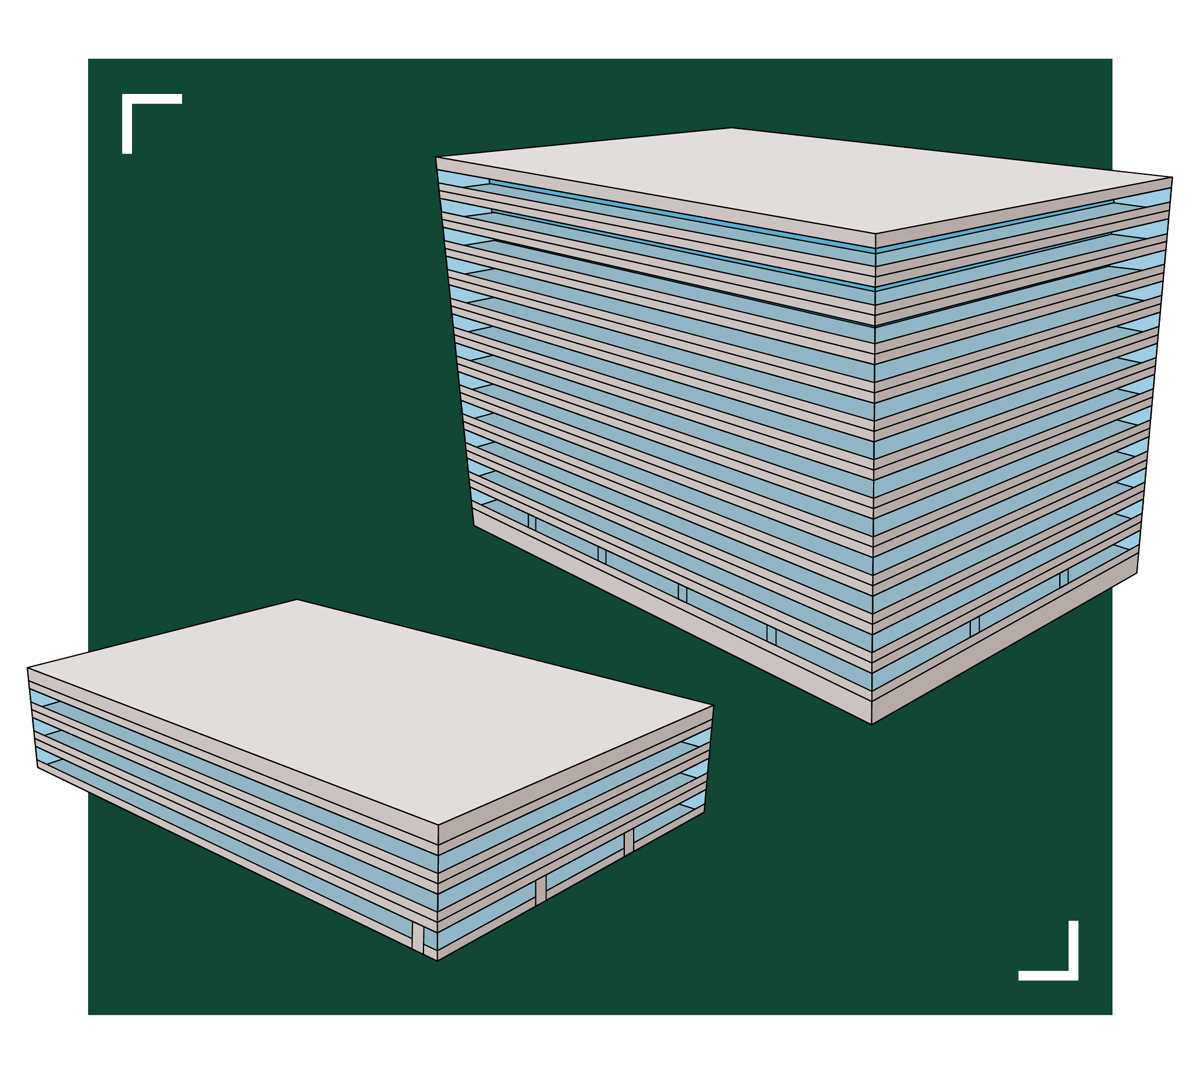
However, even when normalized by floor area, the size of a building can have a significant impact on the LCA results. Within the DOE’s set of prototypical buildings, there are three sizes of office building: small, medium, and large, each with prescribed plan dimensions and number of stories. The studies referenced above focus on the medium and large sizes. The medium office is three stories tall with a total building area of approximately 55,000 square feet (5,110 square meters). The large office has 12 stories above grade and one below-grade level with a total building area of approximately 500,000 square feet (46,500 square meters).
Other variables being equal, the studies show that the large office building prototype has a higher normalized GWP than the medium office building prototype. The percentage increase varies depending on the structural system. For example, the normalized GWP values1 for the gravity-only building design2 ranged from about a 28% increase for the large concrete office building to a 100% increase for the large mass timber office buildings (Figure 1).
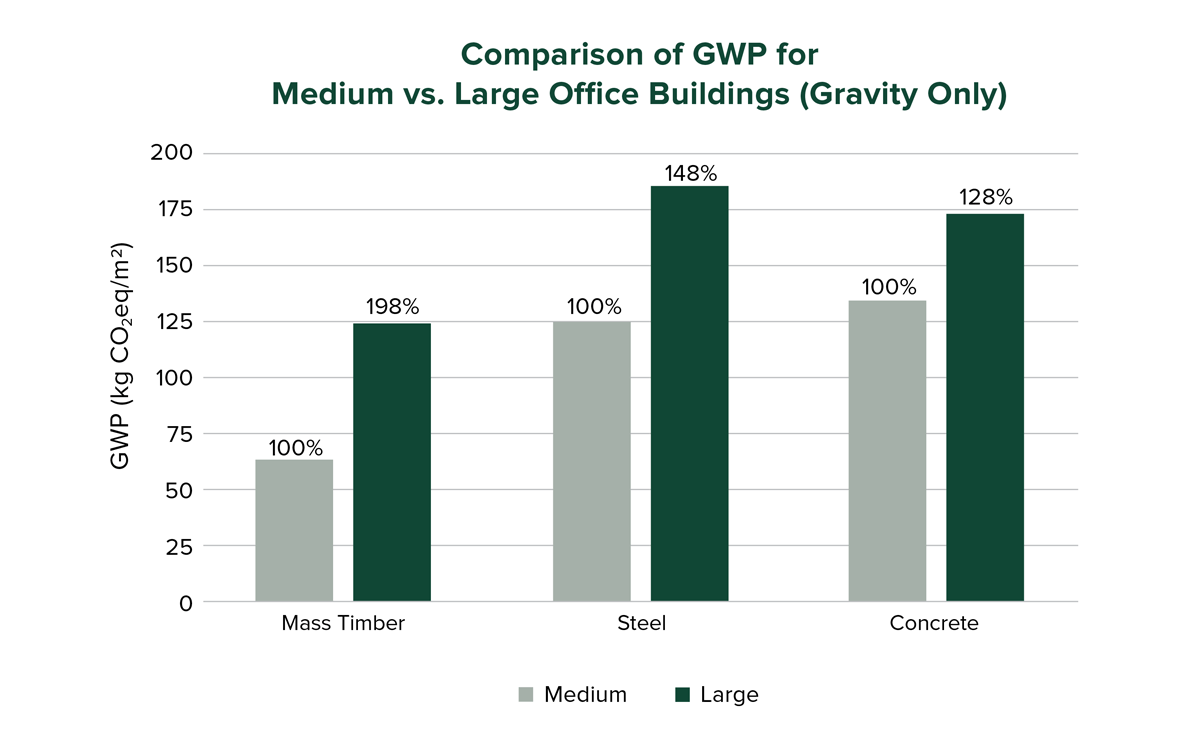
FIGURE 1: Normalized GWP for the gravity-only design of medium and large office buildings. Percent values represent the percent GWP increase for the large building as compared to the medium building for each structural system.
Although the percentage increase in GWP for large office buildings also varies based on the seismic design hazard (discussed in the following section), both studies consistently show that the large office building designs have larger normalized impacts than the medium office buildings. However, the magnitude of that increase is difficult to estimate without evaluating the unique structural conditions of each building.
The large office prototype used in these studies was both taller and had a larger footprint than the medium office prototype. While outside the scope of this work, the pattern that a larger building has a larger normalized GWP appears to be primarily tied to the building’s height. When looking at buildings with smaller aspect ratios (e.g., low-rise buildings with sprawling footprints), this relationship could be inverted due to the ratios of exterior wall area to floor area. For example, a single-story building with a large footprint could have a smaller normalized GWP than one with a small footprint. This indicates that simply normalizing GWP results across a wide range of building sizes, without considering the building’s height or aspect ratio, may not be an appropriate benchmarking approach.
Structural Design Loads
As indicated, comparative GWP outcomes also differ for buildings in high-seismic versus moderate-seismic regions. In the two example studies, the high-seismic case is in Seismic Design Category D, while the moderate-seismic case is in Seismic Design Category C. Because of the significant differences in structural design and detailing requirements between these categories, the material quantities are higher for the high-seismic location, resulting in higher GWP.
The percentage increase varies depending on the building’s size and structural system. For example, the medium office building showed GWP increases of 20% to 45% for high-seismic versus moderate-seismic design for all building systems (Figure 2). However, the increases were more variable for the large office building, depending on the type of lateral system. Buildings with steel braced frames or mass timber rocking walls showed similar GWP increases of 20% to 35% for the high-seismic location while buildings with concrete shear walls showed more significant increases of 65% to 80% (Figure 3). This is primarily due to specific design requirements for concrete shear walls in Seismic Design Categories D, E, and F that took effect under the 2021 International Building Code (IBC) and the American Concrete Institute’s 2019 Building Code Requirements for Structural Concrete (ACI 318-19).
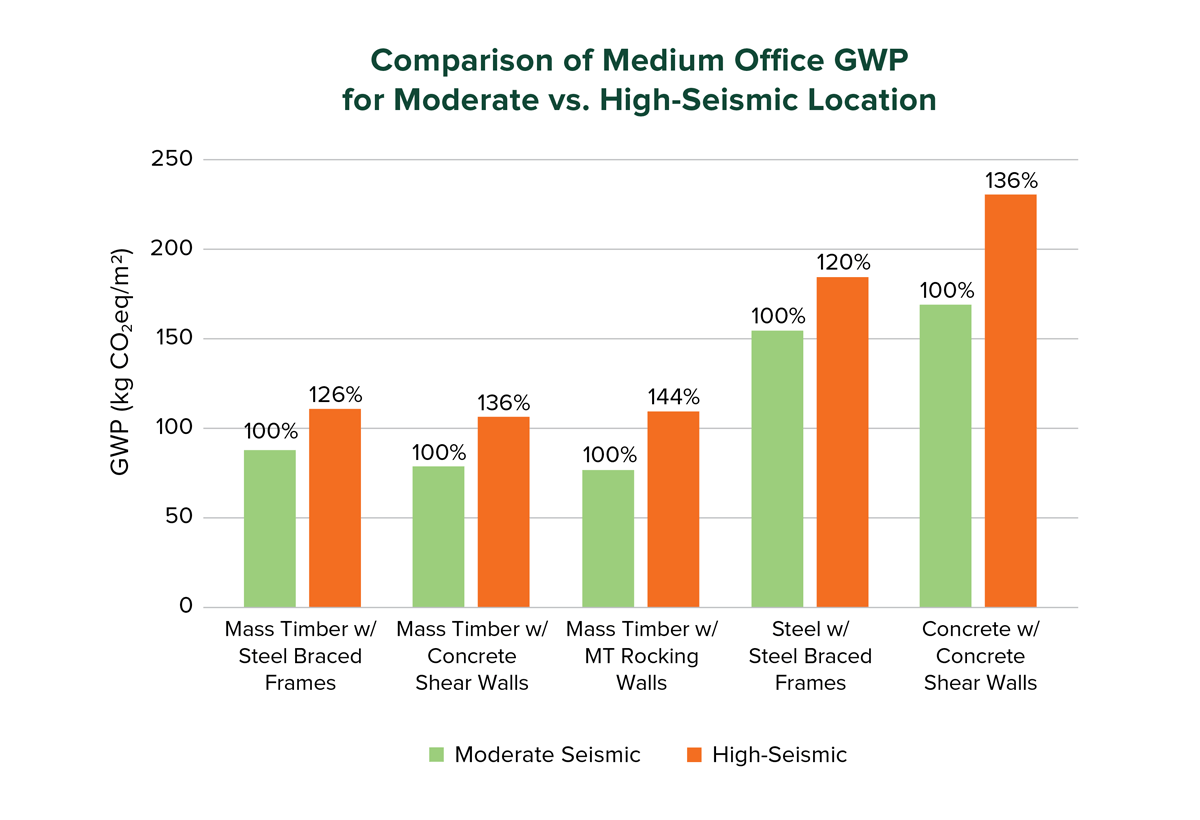
FIGURE 2: Normalized GWP for medium office building in high- and moderate-seismic locations. Percent values represent the percent increase for the high-seismic design as compared to the moderate-seismic design for each structural system.
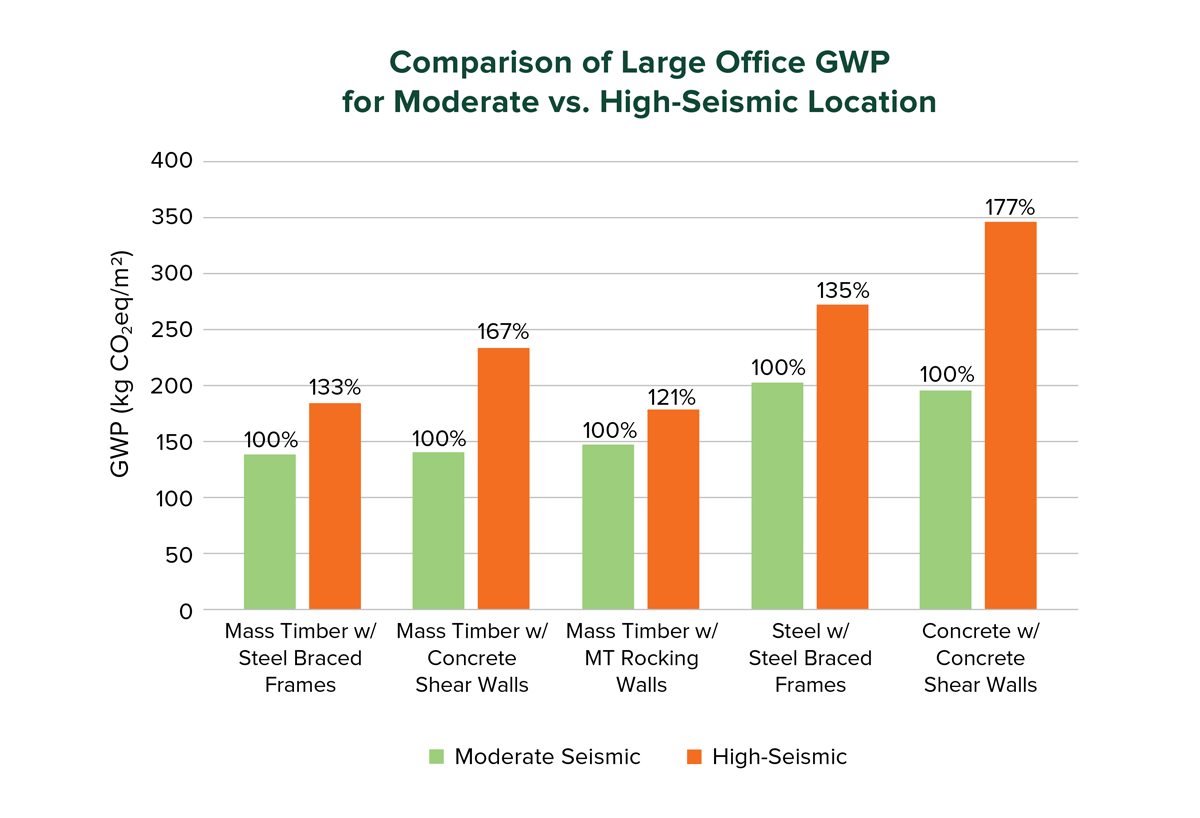
FIGURE 3: Normalized GWP for large office building in high- and moderate-seismic locations. Percent values represent the percent increase for the high-seismic design as compared to the moderate-seismic design for each structural system.
While outside the scope of these studies, preliminary investigations into different wind and snow loads indicated less variability in the structural design than for different seismic loads. It is still reasonable to assume that higher design loads of any type will result in higher structural material quantities and GWP impacts, though the magnitude of those increases is difficult to predict without additional comparative structural designs of the buildings under different design loads. Therefore, it is critical that benchmarks are specific to the regional hazards and loading conditions that apply to the building being assessed.
Building Codes and Standards
As highlighted in the previous discussion, the codes and standards used to develop a building design can play a critical role in the bill of materials and resulting GWP. All of the designs in the referenced LCA studies were based on the 2021 IBC. The results would change if the buildings were designed to a different version of the code, but more importantly, the broad patterns and trends could differ as well. In addition to the example above regarding changes to concrete shear wall design, multiple code changes related to the use of mass timber have been introduced in recent IBC editions. These changes affect both the structural and architectural (e.g., fire protection) material quantities required for a code-compliant project. An effective benchmark will account for the codes and standards used as the basis of design.
Structural Materials and Systems
Even after controlling for the variables discussed above, there is still the question of what building materials and structural systems should be represented in the benchmark. As discussed in the referenced studies, GWP results vary considerably depending on the primary structural material. For example, the medium office building in the moderate-seismic region had GWP values ranging from 75 kg CO2e/m2 for an all-wood system to 170 kg CO2e/m2 for an all-concrete system.
When a benchmark is intended to be representative of constructed projects, it is typically calculated as a weighted average of the GWP values based on the mix of materials commonly used in business-as-usual construction. However, this can be complicated by regional differences in construction practices and preferred structural systems. For example, in one metropolitan area, the majority of medium-sized office buildings might be built with concrete using reinforced columns and post-tensioned flat slabs, while steel framing with concrete-topped metal deck may be the dominant system in another. As a result, the appropriate benchmark values would be different for the two areas.
Depending on the intended purpose of the benchmark, it may need to be developed at a regional scale to reflect local construction practices and provide meaningful comparisons for new buildings in that area.
Other Design Considerations
The previous sections highlight several building characteristics that influence the development of appropriate benchmarks. However, every building is unique and there are additional qualitative factors that should be considered when evaluating GWP. For example, some buildings are designed to maximize structural, material, and cost efficiency through simple rectangular forms and regular layouts. These buildings will generally have lower GWP values than ones with more architectural complexity, unique features, and greater structural demands. There can be external factors that influence the design—such as irregularly shaped sites, stepped elevations due to sloping properties or zoning height limits, poor soil conditions that require extensive foundation work, or other unique design conditions dictated by local requirements. As such, benchmarks should factor in the relative complexity of the buildings. This is especially true when using prototypical buildings, as prototypes tend to be reasonable but simplified versions of actual buildings and do not fully capture the range of unique features found in real building designs.
There is also a human element to building design. For any building, multiple structural and architectural solutions exist to satisfy the project requirements, each with their own GWP impact. Two project teams may develop different yet equally reasonable designs with comparable but different GWP results. This does not preclude the development of a benchmark, but underscores the importance of using a sufficiently large sample of buildings to capture typical design variations and improve its statistical significance.
Differences in LCA Scope and Methodology
While it is readily apparent that differences in building designs have meaningful impacts on the LCA results, significant differences in LCA scope and methodologies used to assess the designs will similarly affect the results and, consequently, the development of a benchmark.
Physical Boundaries
One of the first considerations is the physical scope of the LCA—i.e., which building systems and materials are included. Some studies, like the two referenced in this article, focus on primary structural materials. Others include architectural components, such as building enclosures, nonstructural partitions, and materials used to meet fire and acoustical code requirements. Based on the specific goal of each study, some LCAs exclude portions of the structural system. For example, foundations and below-grade elements, which are typically constructed with concrete, might be excluded in order to isolate the impacts of the above-grade structural system where designers often have more material options. Beyond the primary architectural and structural components, LCAs can include mechanical, electrical, plumbing, and fire protection (MEPF) systems, site work, and other design elements. Because material quantities directly impact the GWP, the data used to develop a benchmark should be based on a consistent physical scope.3
Level of Development
Once the physical scope has been defined, there can also be variation in the level of detail available when developing the bill of materials. For example, in the two studies, designs were at a design development (DD) level and quantities for items such as connections were estimated based on typical conditions. In some cases, LCAs might be based on early schematic design (SD) quantities with corresponding lower precision in GWP estimates. In others, construction documents (CD) or actual as-built material quantities might be used, providing greater precision. Estimating a more complete bill of materials requires judgment, ideally based on past project experience, and it is impractical to accurately capture the exact quantity of every material that goes into a building. For example, it may be possible to accurately quantify the structural connection materials with CDs or as-built drawings; however, the connection types and materials are commonly not known at DD. As with the range of design choices, this does not preclude the development of a benchmark; rather, it highlights the importance of understanding the level of detail provided and subsequent uncertainty in the results.
Temporal Boundaries
Another variable in the LCA scope is the temporal boundary—i.e., the life cycle stages included in the assessment. The studies referenced in this article provide results for Stages A, A-C, and A-D,4 which clearly demonstrate the impact of LCA stage selection. For the gravity-only building designs, GWP values for Stages A-C are about 10% higher than Stage A only. Stage A-D results have more variation, with most framing systems showing about a 20% increase over Stage A values. The exception is the steel framing system, which shows a slight decrease due to recycling benefits beyond the system boundary that are captured in Module D (Figure 4).
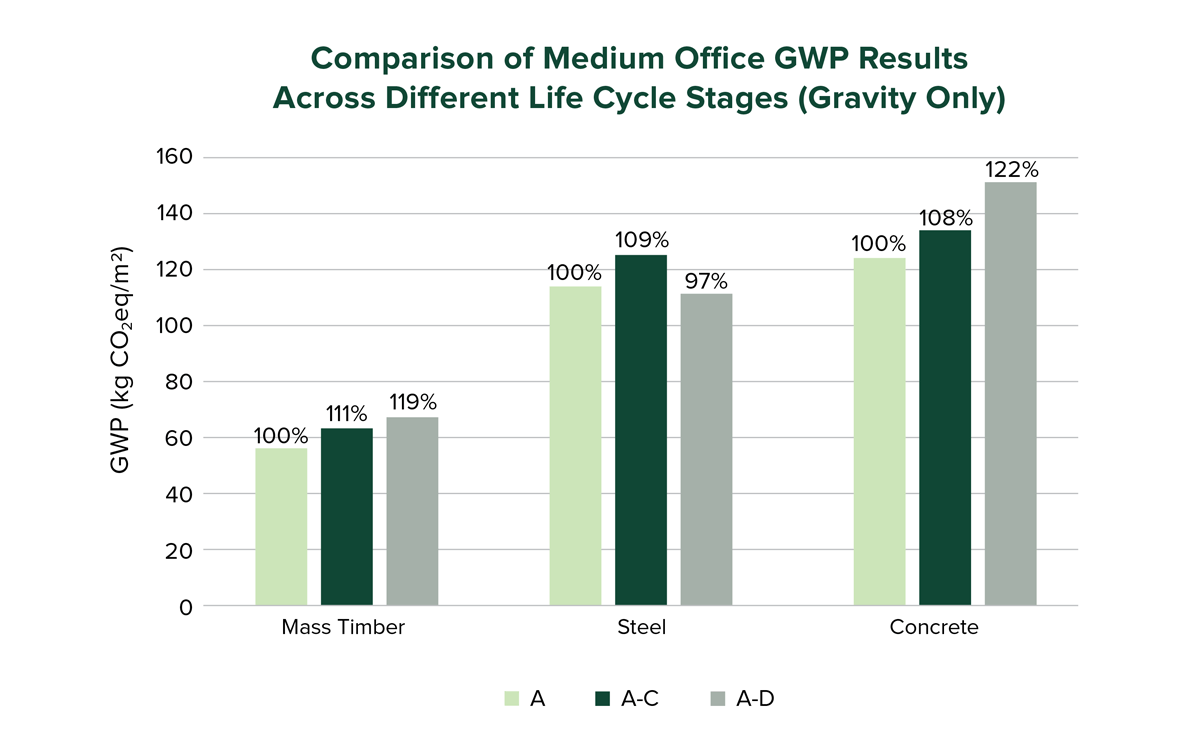
FIGURE 4: Normalized GWP for the gravity-only design of medium office buildings. Percent values represent the percent increase for each set of life cycle stages as compared to the Stage A results for each structural system.
LCA studies with different temporal boundaries are not comparable because the inclusion or exclusion of different life cycle stages has dramatic impacts on the final GWP results. Even beyond the broad definitions of life cycle stage inclusions (e.g., A-C or A-D) there can still be important differences in individual life cycle modules that are included or excluded. For instance, the two referenced studies excluded Stage B. Other studies might exclude individual modules within Stage B (e.g., B1: Use) or individual modules within other stages (e.g., A5: Construction). When developing a benchmark, it is critical to understand what individual modules were included and excluded to determine if the results are comparable.
LCA Tools, Data, and Methodology
One of the most overlooked challenges in developing benchmarks is the variation in assessment methods, which is partly due to the lack of an established building-level LCA standard in the U.S. Additionally, LCA requires assumptions to be made about future conditions, building performance, and material fates, particularly for Stages C and D. Different LCA practitioners use different methods and assumptions to address these unknowns.
To assist with the various methodological decisions that must be made, many project teams use simplified LCA tools developed specifically for building designers. Each tool uses a unique set of background data, simplifying assumptions, and calculation methods. While these tools are useful in making LCA more accessible, they tend to be inconsistent with each other and there can be significant variation among the results.5 The studies referenced in this article were performed using data from the Athena Impact Estimator for Buildings; the GWP results would have been different if the analyses had been performed using TallyLCA or One Click LCA.
In the assessment of wood structures, one of the most significant variables is how each tool handles biogenic carbon. This topic is addressed in detail in Biogenic Carbon Accounting in WBLCA Tools, which shows that the percentage of carbon storage included in the final GWP output varies from 0% to more than 60% depending on the tool. This methodological difference is in addition to other variations among the tools such as the estimated GWP of individual products, impacts associated with construction processes, replacement rates of different materials during the building’s use, end-of-life scenarios for each material, allocation of recycling benefits, and many other estimates, predictions, and assumptions that are made during the analysis.
The results produced using different LCA tools are generally not comparable. But LCA tools also continue to evolve as more data becomes available and methodologies become more standardized, so results using different versions of the same tool are typically also not comparable. When developing benchmarks, it is important to consider the LCA tool and version underlying the benchmark value.
Conclusion
This article addresses the growing interest in developing industry-wide benchmarks to assess the GWP of buildings. Significant challenges exist—in establishing appropriate benchmarks considering the range of building types and design variables and maintaining consistency in how the LCA results are produced—but they are not insurmountable. A successful benchmarking effort must first define a repeatable LCA methodology in terms of LCA scope and the data and tools used to make the assessment. With that information, an appropriate sample set of GWP values developed using the defined methodology can be collected to create a benchmark value. Any future building design whose GWP is compared to the benchmark should have similar functionality, size, and design criteria and follow the same LCA methodology as the buildings used to develop the benchmark.
Development of industry-wide benchmarks will likely need to use GWP values from prototypical designs as well as statistical analyses of actual buildings using a dataset that is sufficiently large and diverse to capture the design variations. Continued standardization in LCA data and methodology is also critical to ensure individual LCA results can be compared and combined in statistical analysis. As the industry works towards developing these values, more limited benchmarking efforts on a project-specific basis or within a somewhat uniform portfolio of buildings—for example, within a firm’s project portfolio or within a city’s inventory of a specific building type—are currently both feasible and practical.
1 For simplicity, the results discussed in this article represent life cycle stages A-C, excluding biogenic carbon. The full LCA reports linked in the article provide results for Stages A, A-C, and A-D, both including and excluding biogenic carbon.
2 The LCA reports show results for the entire structural system including gravity and lateral load-carrying elements. Results of gravity-only elements are used in this article when it is helpful to isolate specific variables (e.g., to focus on the impacts of structural framing options vs. site locations).
3 For a more thorough discussion of the physical elements that may be included or excluded from a WBLCA, see Considerations and Worksheet for Structural WBLCA of Mass Timber Buildings.
4 Life cycle Stage A, which includes Modules A1-A5, is often called “cradle-to-construction gate” and captures the upfront impacts of the building, through construction. Stages A-C capture the building throughout its lifetime, including end-of-life deconstruction impacts. Stages A-D goes beyond the building’s end-of-life. The information modules included in each stage are discussed in Introduction to Whole Building Life Cycle Assessment: The Basics.
5 For an overview of common LCA tools used by the design community and a discussion of their differences, see Carbon Accounting Tools for Structural Systems.
Core funding for this article and the referenced LCA studies was provided by the U.S. Endowment for Forestry and Communities. Funding was also provided in part by the Softwood Lumber Board.